
语法
简介
G2-mobile是G2的一个子集,提供更为精简的功能,供移动端使用。G2-mobile的使用方法与G2相似。
API
new Chart(cfg) 创建图表
- cfg 图表的配置项:
- id: 画布 canvas的id
- margin: 画布内部的边框,可以是数组[top,right,bottom,left] 也可以是一个数字
<canvas id="c1" style="width: 400px; height: 400px;"></canvas>var chart = new Chart({
id: 'c1'
});注意:画布的宽高不再使用配置项,直接在canvas标签中设置
chart.source(data, colDefs) 设置、更改数据源和数据字段
- data 图表的数据,普通的JSON数组
- colDefs: 列定义,定义对应的度量信息,支持的度量的类型有:数字类型(linear)、分类类型(cat)、和时间类型(timeCat)。
var data = [
  {a: '1', b: 123}
];
var defs = {
  b: {
    min: 0,
    tickInterval: 10
  }
}

chart.source(data, defs);
更详细的配置和使用,请参见 Scale API中对数字类型(linear)、分类类型(cat)、和时间类型(timeCat)的介绍
chart.axis(dim, cfg) 设置坐标轴配置项
- dim 坐标轴对应的字段
- cfg 坐标轴支持的配置信息
- grid 栅格线的配置项,符合canvas图形属性, 支持函数function(text, index) 返回栅格的配置项
- line 坐标轴轴线,符合canvas图形属性
- label 坐标轴的文本,符合canvas的文本属性, 支持函数function(text, index) 返回文本的配置项
- labelOffset 文本距离坐标轴的位置
- tickLine 坐标轴上刻度线的配置信息,除了符合canvas图形属性外,还有value(刻度线长度)属性
chart.axis('a',false); // 不显示a字段对应的坐标轴
chart.axis('a', {
  grid: {
    strokeStyle: 'red'
  },
  line: {
    strokeStyle: '#ccc'
  },
  label: {
    textBaseline: 'middle',
    font: '30px sans-serif',
    fillStyle: '#333'
  },
  labelOffset: 20,
  tickLine: {
    value: 10,
    strokeStyle: '#ccc'
  },
});
chart.coord(type, cfg) 坐标系的配置信息
- type 支持笛卡尔坐标系(rect)和极坐标系(polar)
- cfg 坐标系支持的配置信息
- transposed 坐标系的x,y轴是否交换,可以将垂直的柱状图转换成水平的柱状图
- startAngle: 极坐标系的起始角度
- endAngle: 极坐标系的结束角度
- inner: 内部坐标系起始点的半径,[0 - 1]
chart.coord('polar', {
  inner: 0.6,
  startAngle: -Math.PI / 2,
  endAngle: Math.PI * 3 / 2
});
chart.<geom>().<attr>(dim, callback) 添加图层
- geom 目前支持的图表类型有: 点图(point),线图(line),柱状图/饼图(interval),区域图(area),蜡烛图(schema)
- attr 目前支持的方法有: position,color,size 和 shape
- color,size,shape 支持callback方法
- shape: 不同的 geom 几何图形对象支持的 shape 形状如下:
| geom 类型 | shape 类型 | 解释 |
|---|---|---|
| point | 'circle','rect' | |
| line | 'line','smooth','dash' | dash :虚线,smooth: 平滑线 |
| area | 'line','smooth' |
 chart.point().position('a*b').color('c', function(value){
    if(value === '1') {
      return 'red';
    } else {
      return 'blue';
    }
 }).size(3).shape('city', function(city) {
    if (city === 'beijing') {
      return 'line';
    }
    if (city === 'hangzhou') {
      return 'dash';
    }
  });
自定义shape:
- registShape(geomName, shapeName, cfg):注册图形
- 参数
- geomName 几何标记名
- shapeName 注册的具体图形名
- cfg 配置
- getShapePoints(cfg):自定义具体标记点
- 参数:
- cfg.x: x数据
- cfg.y: y数据
- cfg.y0: x轴的y坐标
- cfg.size: 大小数据
- 返回
- 0-1的points数据
- drawShape(cfg,canvas):自定义最终绘制
参数
- cfg 包含points数据和映射后的属性
- canvas 图形容器
var Shape = G2.Shape;
Shape.registShape(/* geomName */, /* shapeName */, { // 向Shape工厂注册某个geom的一个shape
getShapePoints: function( /* cfg */ ) { // 自定义具体标记点
},
drawShape: function( /* cfg, canvas*/ ) { // 自定义最终绘制,无需返回
}
});
更详细的配置和使用,请参见 Geom API中对图表类型和方法的介绍
chart.guide() 辅助元素
- guide目前支持的辅助类型有:折线(line)、弧线(arc)、长方形(rect)文字(text)和自定义(html),其中line、arc、rect是提前绘制在背景上,text和html是最后绘制在图形上
- 自定义html的参数如下:
- point: 放置html的坐标点
- html: html文本
- cfg: 配置信息,支持对齐(align)和偏移(offset)
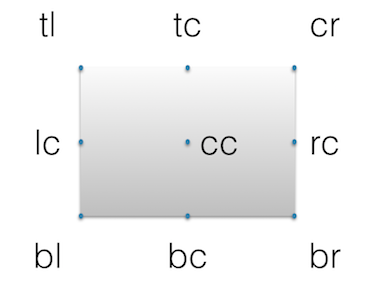
对齐方式:支持tr、tc、tl、br、bc、bl、lc、rc、cc9点对齐
var point = ['周日',28];
var html = "<div style='border-radius: 12px;border: none;width: 22px;height: 22px;background-color: rgba(102, 182, 241, 0.5);'></div>";
var cfg = {
  align: 'cc',
  offset: [-5,-5]
}

chart.guide().html(point,html,cfg);
折线(line)、弧线(arc)、文字(text)、长方形(rect)的配置和使用,请参见 Chart API
chart.animate() 动画
- animate目前支持的动画类型有:水平方向的平铺(waveh)、环形平铺(wavec)、x轴上的缩放(scalex)、y轴上的缩放(scaley)、x和y轴同时缩放(scalexy)
动画降频:配置全局变量Global.animateReduceMultiple(动画降频倍数,默认为1)
chart.animate().scalex();
chart.render() 绘制图表
chart.clear() 清空图表
chart.getPosition(record) 获取位置信息
- 将数据传入图表,返回画布上点的位置
chart.getRecord(point) 获取数据值
- 将画布上的点传入图表,返回数据值
chart.getSnapRecord(point) 获取纵切面交点的数据集
- 将画布上的点传入图表,返回纵切面交点的数据集数组
G2-mobile不支持的图形绘制属性:
- fillOpacity
- strokeOpacity
全局属性
Global
var axisLineColor = '#999999';
var lineColor = '#E9E9E9';
var defaultAxis = {
  label: {
    fillStyle: '#979797',
    font: '20px san-serif',
    offset: 6
  },
  line: {
    stroke: lineColor,
    lineWidth: 1
  },
  grid: {
    stroke: lineColor,
    lineWidth: 1
  },
  tick: null
};
var defaultFont = {
  fontStyle: '',
  fontVariant: '',
  fontWeight: '',
  fontSize: '10px',
  fontFamily: '"Helvetica Neue", Helvetica, "PingFang SC", "Hiragino Sans GB", "Microsoft YaHei", "微软雅黑", SimSun, "sans-serif"'
};

var Global = {
  // 大小
  sizes: {
    min: 1,
    max: 10
  },
  // 预先定义的度量
  scales: {
    nice: true
  },
  // 宽度
  widthRatio: { // 宽度所占的分类的比例
    column: 1 / 2, // 一般的柱状图占比 1/2
    rose: 0.999999,
    multiplePie: 3 / 4
  },
  // 动画降频倍数
  animateReduceMultiple: 1,

  // 皮肤
  defaultFont: defaultFont,
  pixelRatio: 1,
  margin: [40, 40, 40, 40],
  colors: ['#4E7CCC', '#36B3C3', '#4ECDA5', '#94E08A', '#E2F194', '#EDCC72', '#F8AB60', '#F9815C', '#EB4456', '#C82B3D'],
  axis: {
    bottom: Util.mix(true, {}, defaultAxis, {
      line: {
        stroke: axisLineColor
      },
      label: {
        textBaseline: 'hanging',
        offset: 12
      },
      gridAttrs: {},
      grid: function(text, index, total) {
        if (index === 0 || index === total - 1) {
          return null;
        }
        return Util.mix({}, defaultAxis.grid, Theme.axis.bottom.gridAttrs);
      }
    }),
    left: Util.mix(true, {}, defaultAxis, {
      label: {
        textAlign: 'end'
      },
      line: null,
      tick: null
    }),
    right: Util.mix(true, {}, defaultAxis, {
      label: {
        textAlign: 'start'
      },
      line: null,
      tick: null,
      grid: null
    }),
    circle: Util.mix(true, {}, defaultAxis, {
      line: {
        stroke: axisLineColor
      }
    }),
    radius: Util.mix(true, {}, defaultAxis, {})
  }
};

module.exports = Global;