
教程
坐标轴在 G2 中属于辅助元素,作为坐标系的组成部分,所以在图表生成的时候,G2 会默认为图表生成坐标轴,当然也提供了各种坐标轴的配置支持,基本语法如下:
chart.axis('dim', cfg); // 配置坐标轴的配置项
chart.axis('dim', false); // 不显示对应的坐标轴
chart.axis(false); // 全部不显示坐标轴- G2 可以配置数据字段对应的坐标轴的配置项,也可以不显示对应的坐标轴
chart.axis(dim, cfg) 中 cfg 的具体的参数,具体使用详见 chart.axis()。
坐标轴标题设置别名
坐标轴的别名,需要在列定义中为该坐标轴对应的数据属性设置 alias 参数。
chart.source(data, {
    weight: {
      alias: '体重(kg)' // 为 y 轴设置别名
    }
  });
完整代码:
$.getJSON('../static/data/scatter.json',function(data){
  var frame = new G2.Frame(data);
  var hAvg = G2.Frame.mean(frame,'height'); // 计算体重的均值
  var wAvg = G2.Frame.mean(frame,'weight'); // 计算身高均值
  var lineCfg = { // 线的配置信息
    stroke: '#94E08A'
  };
  var chart = new G2.Chart({
    id: 'c1',
    width : 800,
    height : 400
  });
  chart.source(data, {
    weight: {
      alias: '体重(kg)' // 为 y 轴设置别名
    },
    height: {
      alias: '身高(cm)' // 为 x 轴设置别名
    }
  });
  chart.tooltip({
    title: null
  });
  chart.point().position('height*weight').color('gender', ['rgba(223, 83, 83, 0.7)', 'rgba(119, 152, 191, 0.7)']).shape('gender', ['circle', 'diamond']).size(6).tooltip('gender*height*weight');
  chart.guide().tag([hAvg, 'min'], [hAvg, 'max'], '身高平均值: ' + hAvg.toFixed(2), {line:lineCfg});
  chart.guide().tag(['min', wAvg], ['max', wAvg], '体重平均值: ' + wAvg.toFixed(2), {line:lineCfg});
  chart.render();
});
个性化坐标轴样式
下图标识了可以由用户进行配置的坐标轴元素:
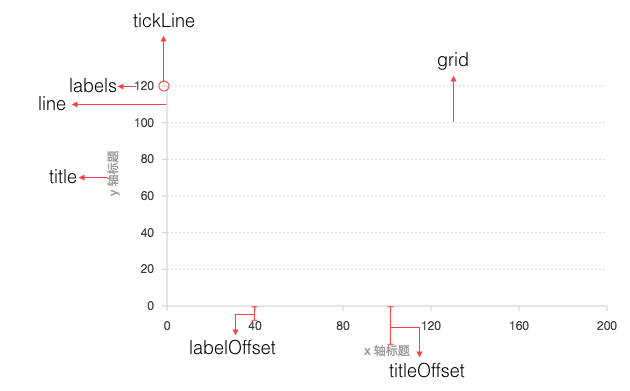
通过为以上的坐标轴元素设置属性,就可以实现坐标轴样式的自定义配置,对于具体的配置参数,详见chart.axis()。
完整代码如下:
$.getJSON('../static/data/avg-temp.json',function(data){
  var Frame = G2.Frame;
  var frame = new Frame(data);
  frame = Frame.combinColumns(frame, ['New York', 'San Francisco','Austin'], 'value', 'city', 'date');
  var chart = new G2.Chart({
    id: 'c2',
    width : 800,
    height : 400,
    plotCfg: {
      margin: [20, 120, 80, 80]
    }
  });
  chart.source(frame, {
    date: {
      type: 'time',
      mask: 'yyyy.mm',
      tickCount: 12
    },
    value: {
      alias: 'Temperature, ºF'
    }
  });
  chart.axis('date', {
    line: null,
    tickLine: {
      stroke: '#000',
      value: 6 // 刻度线长度
    },
    title: null
  });
  chart.axis('value', {
    tickLine: {
      stroke: '#000',
      value: 6 // 刻度线长度
    },
    labels: {
      label: {
        fill: '#000'
      }
    },
    line: {
      stroke: '#000'
    },
    grid: null
  });
  chart.line().position('date*value').color('city', ['#1f77b4', '#ff7f0e', '#2ca02c']).shape('spline').size(2);
  chart.render();
});
格式化坐标轴文本显示
chart.axis('x', {
  // 使用 formatter 回调函数
  formatter: function(val) {
      return val + '元';
  }
});
完整代码如下:
var data = [
  { x: 95, y: 95, z: 13.8, name: 'BE', country: 'Belgium' },
  { x: 86.5, y: 102.9, z: 14.7, name: 'DE', country: 'Germany' },
  { x: 80.8, y: 91.5, z: 15.8, name: 'FI', country: 'Finland' },
  { x: 80.4, y: 102.5, z: 12, name: 'NL', country: 'Netherlands' },
  { x: 80.3, y: 86.1, z: 11.8, name: 'SE', country: 'Sweden' },
  { x: 78.4, y: 70.1, z: 16.6, name: 'ES', country: 'Spain' },
  { x: 74.2, y: 68.5, z: 14.5, name: 'FR', country: 'France' },
  { x: 73.5, y: 83.1, z: 10, name: 'NO', country: 'Norway' },
  { x: 71, y: 93.2, z: 24.7, name: 'UK', country: 'United Kingdom' },
  { x: 69.2, y: 57.6, z: 10.4, name: 'IT', country: 'Italy' },
  { x: 68.6, y: 20, z: 16, name: 'RU', country: 'Russia' },
  { x: 65.5, y: 126.4, z: 35.3, name: 'US', country: 'United States' },
  { x: 65.4, y: 50.8, z: 28.5, name: 'HU', country: 'Hungary' },
  { x: 63.4, y: 51.8, z: 15.4, name: 'PT', country: 'Portugal' },
  { x: 64, y: 82.9, z: 31.3, name: 'NZ', country: 'New Zealand' }
];
var chart = new G2.Chart({
  id: 'c3',
  width: 600,
  height: 300,
  plotCfg: {
    background: {
      stroke: '#ccc', // 边颜色
      lineWidth: 1, // 边框粗细
    } // 绘图区域背景设置
  }
});
chart.source(data, {
  x: {
    alias: 'Daily fat intake', // 定义别名
    tickInterval: 5, // 自定义刻度间距
    nice: false, // 不对最大最小值优化
    max: 96, // 自定义最大值
    min: 62 // 自定义最小是
  },
  y: {
    alias: 'Daily sugar intake',
    tickInterval: 50,
    nice: false,
    max: 165,
    min: 0
  },
  z: {
    alias: 'Obesity(adults) %'
  }
});
// 开始配置坐标轴
chart.axis('x', {
  formatter: function(val) {
    return val + ' gr'; // 格式化坐标轴显示文本
  },
  grid: {
    line: {
      stroke: '#d9d9d9',
      lineWidth: 1,
      lineDash: [2,2]
    }
  }
});
chart.axis('y', {
  titleOffset: 80, // 设置标题距离坐标轴的距离
  formatter: function(val) {
    if (val > 0) {
      return val + ' gr';
    }
  }
});
chart.legend(false);
chart.tooltip({
  map: {
    title: 'country'
  }
});
chart.point().position('x*y').size('z', 40, 10).label('name*country', {
  offset:0, // 文本距离图形的距离
  label: {
    fill: '#000',
    fontWeight: 'bold', // 文本粗细
    shadowBlur: 5, // 文本阴影模糊
    shadowColor: '#fff' // 阴影颜色
  },
}).color('#3182bd').opacity(0.5).shape('circle').tooltip('x*y*z');
chart.render();