
教程
坐标系描述了数据是如何映射到图形所在的平面,我们通常使用的是笛卡尔坐标系,但也可以将其变换为其他类型,如极坐标和地图投影。
在 G2 中坐标系模块只提供以下两种功能:
- 将经过度量(即归一化)后的数据转换成画布上的坐标数据;
- 把画布上的坐标数据还原到 [0, 1] 区间内的数据。
坐标系的绘图范围
G2 的坐标系和 canvas 坐标系的原点是不一样的,如下图所示:
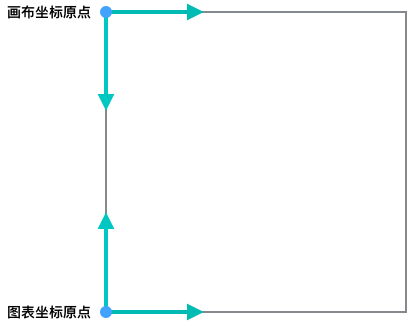
G2 的图表的坐标系原点在左下角,而 canvas 的坐标系原点在左上角。
G2 设置坐标系
G2 默认的坐标系类型为笛卡尔坐标系,当不满足用户需求时,可以通过调用下面的语法声明需要使用的坐标系:
chart.coord('coordType'[, cfg]);| coordType | 说明 |
|---|---|
rect |
直角坐标系,目前仅支持二维,由x, y两个互相垂直的坐标轴构成。 |
polar |
极坐标系,由角度和半径2个维度构成。 |
plus |
一种存在空心的极坐标系,半径不是从圆心开始,构建出来的坐标系。 |
theta |
一种特殊的极坐标系,半径长度固定,仅仅将数据映射到角度,常用于实现饼图。 |
map |
地理坐标系,支持不同类型的地理投影。 |
helix |
螺旋坐标系,基于阿基米德螺旋线。 |
坐标系变换
G2 提供的坐标系支持一系列的坐标系变换:
- translate: 平移,沿 x, y 轴方向移动;
- rotate: 旋转,默认按照坐标系中心旋转;
- scale: 放大、缩小,默认按照坐标系中心放大、缩小;
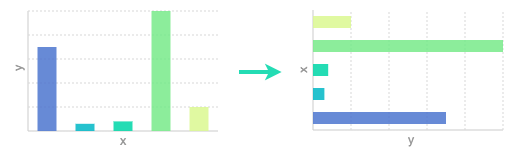
transpose: x,y 轴交换,例如柱状图转换成水平柱状图(条形图);
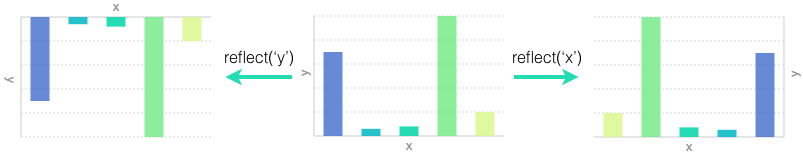
reflect: 镜像, 沿 x 方向镜像或者沿 y 轴方向映射。
以下是坐标系变换的语法,对于多种变换,可以直接使用链式调用的方法。
chart.coord().rotate(90).scale(1.3, 5).reflect('x').transpose();环图绘制
通过为极坐标设置 inner 参数,该参数代码内部空心圆的半径。
chart.coord('theta', {
  inner: 0.5
});
完整代码:
var data = [
  {year:2007, area:'亚太地区', profit: 7860*0.189},
  {year:2007, area:'非洲及中东', profit: 7860*0.042},
  {year:2007, area:'拉丁美洲', profit: 7860*0.025},
  {year:2007, area:'中欧和东欧', profit: 7860*0.018},
  {year:2007, area:'西欧', profit: 7860*0.462},
  {year:2007, area:'北美', profit: 7860*0.265},
  {year:2011, area:'亚太地区', profit: 7620*0.539},
  {year:2011, area:'非洲及中东', profit: 7620*0.065},
  {year:2011, area:'拉丁美洲', profit: 7620*0.065},
  {year:2011, area:'中欧和东欧', profit: 7620*0.034},
  {year:2011, area:'西欧', profit: 7620*0.063},
  {year:2011, area:'北美', profit: 7620*0.234}
];

var Stat = G2.Stat;
var chart = new G2.Chart({
  id: 'c1',
  width: 500,
  height: 350,
  plotCfg: {
    margin: [20, 80, 100, 80]
  }
});
chart.source(data);
chart.legend({
  position: 'bottom'
});
chart.coord('theta', {
  inner: 0.6
});
chart.tooltip({
  title: null
});
chart.intervalStack().position(Stat.summary.percent('profit'))
  .color('area')
  .label('..percent')
  .style({ // 为每个扇形设置白色边框
    lineWidth: 4,
    stroke: '#fff'
  });
chart.render();
扇形图表绘制
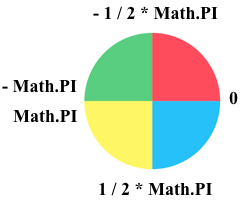
同时我们可以通过设置 startAngle 和 endAngle 两个属性为极坐标设置起始和结束的角度来绘制一些个性化的图表。
chart.coord('theta', {
  startAngle:  Math.PI,
  endAngle: 7 * Math.PI
});
下图标注了 G2 中极坐标的角度。
完整代码:
var data = [
  {area:'成分一', value: 100},
  {area:'成分二', value: 100},
  {area:'成分三', value: 100},
  {area:'成分四', value: 100},
];

var Stat = G2.Stat;
var chart = new G2.Chart({
  id: 'c2',
  width: 500,
  height: 350
});
chart.source(data);
chart.legend({
  position: 'bottom'
});
chart.coord('theta', {
  startAngle: - 5 / 6 * Math.PI,
  endAngle:  - 1 / 6 * Math.PI
});
chart.tooltip({
  title: null
});
chart.intervalStack().position(Stat.summary.percent('value'))
  .color('area', ['#ef5350', '#29B6F6', '#FFEE58', '#66BB6A']);
chart.render();
albers 地理投影坐标系
chart.coord('map', {
  projection: 'albers', // 指定投影方法
  basic: [110, 0, 25, 47], // 指定投影方法的基本参数
  max: [16.573, -13.613], // 指定投影后最大的坐标点
  min: [-27.187, -49.739] // 指定投影后最小的坐标点
});
不同的投影支持的配置参数不同,目前 G2 提供了两种投影坐标,分别是:mecator、albers 这两种,下面的例子展示的 albers 投影的世界地图。
完整代码:
var Stat = G2.Stat;
$.getJSON('../static/data/world.geo.json', function(mapData){
  var userData = [];
  var features = mapData.features;
  for(var i=0; i<features.length; i++) {
    var name = features[i].properties.name;
    userData.push({
      "name": name,
      "value": Math.round(Math.random()*1000)
    });
  }
  var chart = new G2.Chart({
    id: 'c3',
    width: 800,
    height: 400,
    plotCfg: {
      margin: [50, 80]
    }
  });
  chart.source(userData, {
    '..long': {
      tickCount: 10
    }
  });
  chart.coord('map', {
    projection: 'albers',
    basic: [0, 0, 0, 60], // 指定投影方法的基本参数,[λ0, φ0, φ1, φ2] 分别表示中央经度、坐标起始纬度、第一标准纬度、第二标准纬度
    max: [161.89, 120.635], // 指定投影后最大的坐标点
    min: [-144.485, -27.666] // 指定投影后最小的坐标点
  });
  chart.axis('..long', {
    tickLine: null,
    labels: null,
    grid: {
      line: {
        stroke: '#d9d9d9',
        lineWidth: 2,
        lineDash: [4, 4]
      }
    }
  });
  chart.axis('..lant', {
    tickLine: null,
    labels: null,
    line: null,
    grid: {
      line: {
        stroke: '#d9d9d9',
        lineWidth: 2,
        lineDash: [4, 4]
      }
    }
  });
  chart.legend(false);
  chart.polygon()
    .position(Stat.map.region('name', mapData))
    .tooltip('name*value')
    .color('name', function(val){
      if(val === 'China') {
        return '#F9815C';
      } else {
        return '#5479A9'; // 返回默认颜色
      }
    });
  chart.render();
});