教程
布局简介
G2可以通过点和边来实现树图、网络图等关系图,而节点的位置需要使用布局算法来确定,常见的布局算法分为:
- 树的布局算法,有正交布局、径向布局、缩进布局、圆锥布局等
- 图的布局算法,有力导布局、MDS布局等
上面的布局算法在D3中都有介绍,本章仅介绍G2实现的布局算法和一些约定
节点和链接
关系图一般使用节点-链接法绘制,使用节点表示对象,用线(或者边)表示关系。节点链接法的布局有几个原则:
- 节点不能相互遮挡、边尽量避免交叉
- 节点的不能移出边界,尽量提升空间利用率
绘制关系图
使用节点-链接法绘制关系图需要两份数据,节点的数据和边的数据。由于G2中一个View只能使用一个数据源,所以在G2中绘制关系图需要两个View,所以在G2中绘制关系图的步骤如下:
- 声明节点和边的数据
- 创建图表
- 绘制边,保证节点绘制在边上面
- 绘制节点
<div id="c1" class="chart-container"></div>
var nodes = [// 节点信息:类别、ID,位置 x,y
  {id: '0',name: '开始',type: 'start',x: 50,y: 10},
  {id: '1',name: '步骤一',type: 'action',x: 50,y: 20},
  {id: '2',name: '步骤二',type: 'action',x: 50,y: 30},
  {id: '3',name: '条件',type: 'condition',x: 50,y: 40},
  {id: '4.1',name: '分步骤一',type: 'action',x: 40,y: 50},
  {id: '4.2',name: '分步骤二',type: 'action',x: 60,y: 50},
  {id: '5',name: '汇总',type: 'action',x: 50,y: 60},
  {id: '6',name: '结束',type: 'end',x: 50,y: 70}
];
var edges = [
  {source: '0', target: '1'},
  {source: '1', target: '2'},
  {source: '2', target: '3'},
  {source: '3', target: '4.1'},
  {source: '3', target: '4.2'},
  {source: '4.1', target: '5'},
  {source: '4.2', target: '5'},
  {source: '5', target: '6'}
];

var Stat = G2.Stat;
var chart = new G2.Chart({
  id: 'c1',
  width: 1000,
  height: 500,
  plotCfg: {
    margin: [0,0]
  }
});

var defs = {
  x: {min: 0,max:100},
  y: {min: 0, max:100},
  '..x': {min: 0,max:100},
  '..y': {min: 0,max:100}
};

// 首先绘制 edges,点要在边的上面
// 创建单独的视图
var edgeView = chart.createView();
edgeView.source(edges, defs);
edgeView.coord().reflect(); // 从上到下
edgeView.axis(false);
edgeView.tooltip(false);
// Stat.link 方法会生成 ..x, ..y的字段类型,数值范围是 0-1
edgeView.edge()
  .position(Stat.link('source*target',nodes))
  .color('#ccc');

// 绘制节点
var nodeView = chart.createView();
nodeView.coord().reflect(); // 从上到下
nodeView.axis(false);
nodeView.source(nodes, defs);
nodeView.point().position('x*y').color('steelblue')
  .label('name', {
  offset: 10
})
  .tooltip('name');
chart.render();
注意事项:
- 由于节点和链接在两个视图上,所以需要统一两个视图的x,y的度量
- 链接需要使用节点计算线(边)的起始、结束为止,所以需要统计函数 Stat.link
- 节点中需要 x,y,id 字段,方便边的起始、结束点计算
布局算法的作用
在G2中只要我们知道节点的位置和对应的边就能绘制出关系图,在G2中布局算法不是必须的,只要能够计算出节点的位置即可,计算出来的节点需要满足:
- 节点中需要 x,y,id 字段,方便边的起始、结束点计算
- 计算出来的x,y的值都要分布在 [0-1]的范围内
G2 实现的布局算法
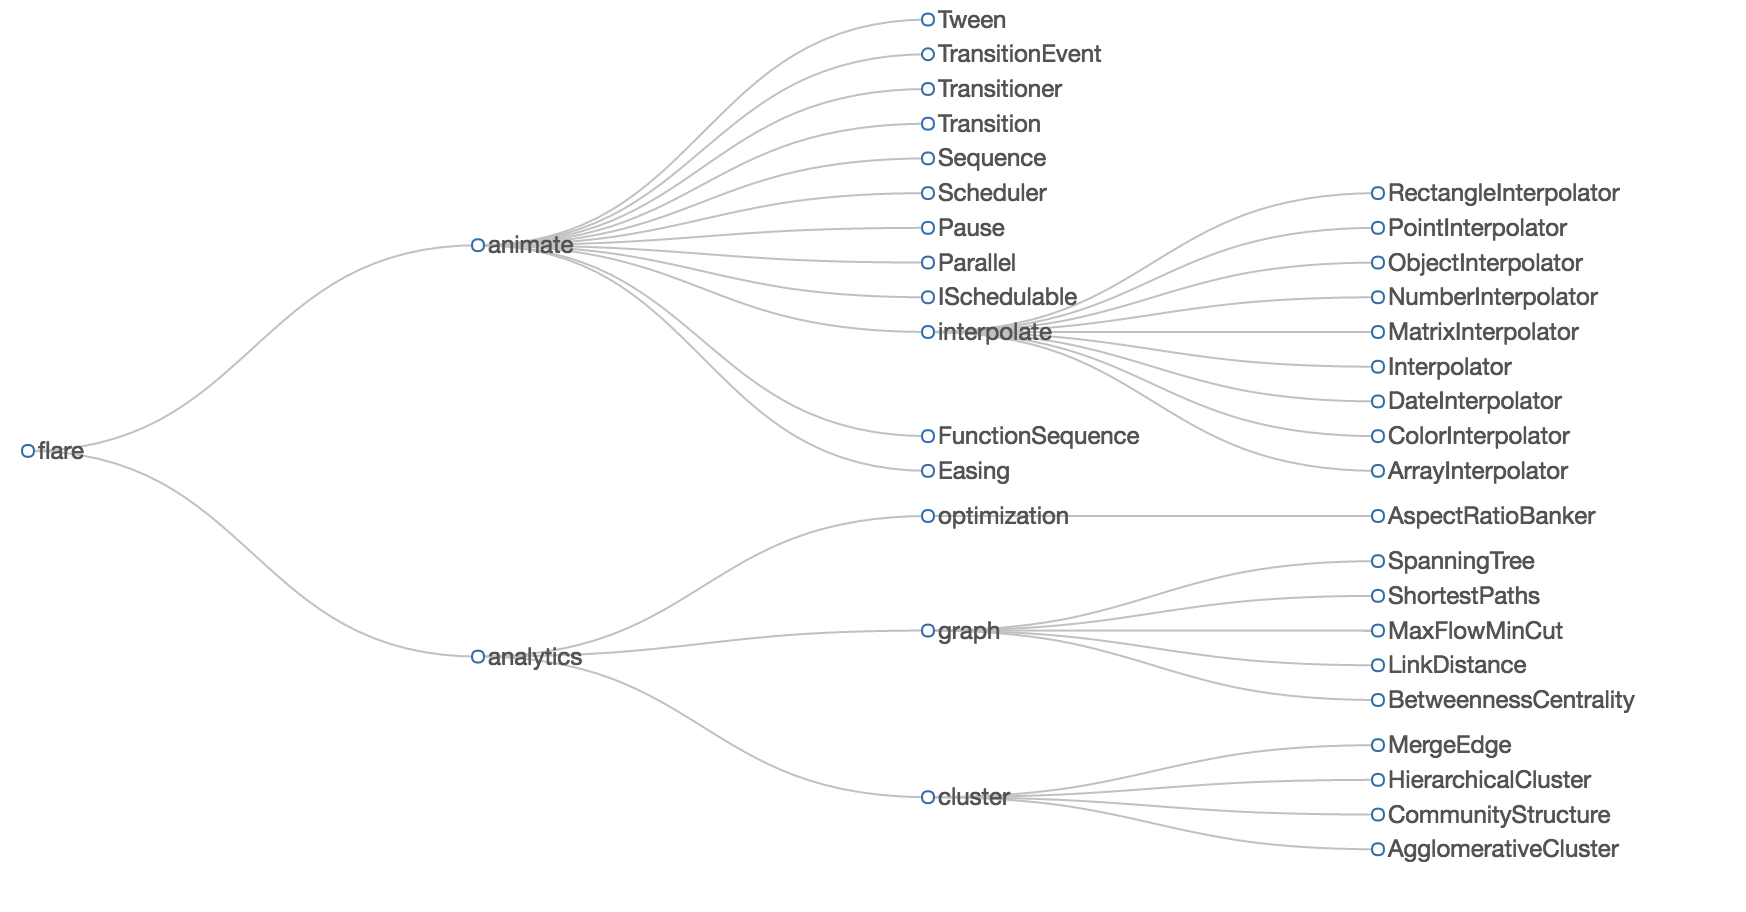
G2 目前仅支持了树的正交布局,保证树的空间利用率最高

使用方式
使用正交布局的步骤
- 指定数据源
- 使用布局算法计算树节点的位置,获取树节点之间的边
- 分别创建边的视图和节点的视图,传入数据源
- 渲染
<div id="c2" class="chart-container"></div>// 指定数据源
var data = [{
name: 'root',
children: [{
name: 'a',
children: [{
name: 'a1'
}, {
name: 'a2'
}]
}, {
name: 'b',
children: [{
name: 'b1',
children: [{
name: 'b11'
}]
}]
}, {
name: 'c'
}]
}];
var layout = new G2.Layout.Tree({
nodes: data
});
var nodes = layout.getNodes();
var edges = layout.getEdges();
var Stat = G2.Stat;
var chart = new G2.Chart({
id: 'c2',
width: 1000,
height: 500,
plotCfg: {
margin: [20,0]
}
});
var defs = {
x: {min: 0,max:1},
y: {min: 0, max:1}/*, 由于 ..x和..y的默认大小就是 0-1,所以可以不设置
'..x': {min: 0,max:1},
'..y': {min: 0,max:1}*/
};
// 首先绘制 edges,点要在边的上面
// 创建单独的视图
var edgeView = chart.createView();
edgeView.source(edges, defs);
edgeView.coord().reflect(); // 从上到下
edgeView.axis(false);
edgeView.tooltip(false);
// Stat.link 方法会生成 ..x, ..y的字段类型,数值范围是 0-1
edgeView.edge()
.position(Stat.link('source*target',nodes))
.color('#ccc');
// 绘制节点
var nodeView = chart.createView();
nodeView.coord().reflect(); // 从上到下
nodeView.axis(false);
nodeView.source(nodes, defs);
nodeView.point().position('x*y').color('steelblue')
.label('name', {
offset: 10
})
.tooltip('name');
chart.render();如何实现自己的布局算法
实现自己的布局算法非常容易只要满足以下条件:
- 节点的返回值中存在 x,y字段
- 节点和边能够通过id 相互关联起来
使用自己布局算法的注意事项:
- 统一边和节点视图的 x,y度量的大小范围
示例
我们以最简单的随机布局来介绍如何实现自己的算法,步骤如下:
- 设定数据源
- 随机指定节点的位置
- 在G2中使用布局算法
<div id="c3" class="chart-container"></div>var data = [
{id: '1', name: '1'},
{id: '2', name: '2'},
{id: '3', name: '3'},
{id: '4', name: '4'},
{id: '5', name: '5'},
{id: '6', name: '6'}
];
var edges = [
{source: '0', target: '1'},
{source: '1', target: '2'},
{source: '2', target: '3'},
{source: '3', target: '5'},
{source: '3', target: '6'},
{source: '4', target: '2'},
{source: '5', target: '6'}
];
// 自己的随机布局算法
function layout(nodes) {
var rst = [];
nodes.forEach(function(node) {
var obj = {};
obj.id = node.id;
obj.name = node.name;
obj.x = Math.random();
obj.y = Math.random(); // 使得 x,y随机的分布在0-1范围内
rst.push(obj);
});
return rst;
}
// 调用布局算法
var nodes = layout(data);
var Stat = G2.Stat;
var chart = new G2.Chart({
id: 'c3',
width: 1000,
height: 500,
plotCfg: {
margin: [20,20]
}
});
var defs = {
x: {min: 0,max:1},
y: {min: 0, max:1}/*, 由于 ..x和..y的默认大小就是 0-1,所以可以不设置
'..x': {min: 0,max:1},
'..y': {min: 0,max:1}*/
};
// 首先绘制 edges,点要在边的上面
// 创建单独的视图
var edgeView = chart.createView();
edgeView.source(edges, defs);
edgeView.coord().reflect(); // 从上到下
edgeView.axis(false);
edgeView.tooltip(false);
// Stat.link 方法会生成 ..x, ..y的字段类型,数值范围是 0-1
edgeView.edge()
.position(Stat.link('source*target',nodes))
.color('#ccc');
// 绘制节点
var nodeView = chart.createView();
nodeView.coord().reflect(); // 从上到下
nodeView.axis(false);
nodeView.source(nodes, defs);
nodeView.point().position('x*y')
.size(10)
.label('name', {
offset: 0
})
.tooltip('name');
chart.render();更多
本章介绍了G2支持的布局算法和如何实现自己的布局算法,在使用过程中可以从其他框架迁移相应的布局算法。